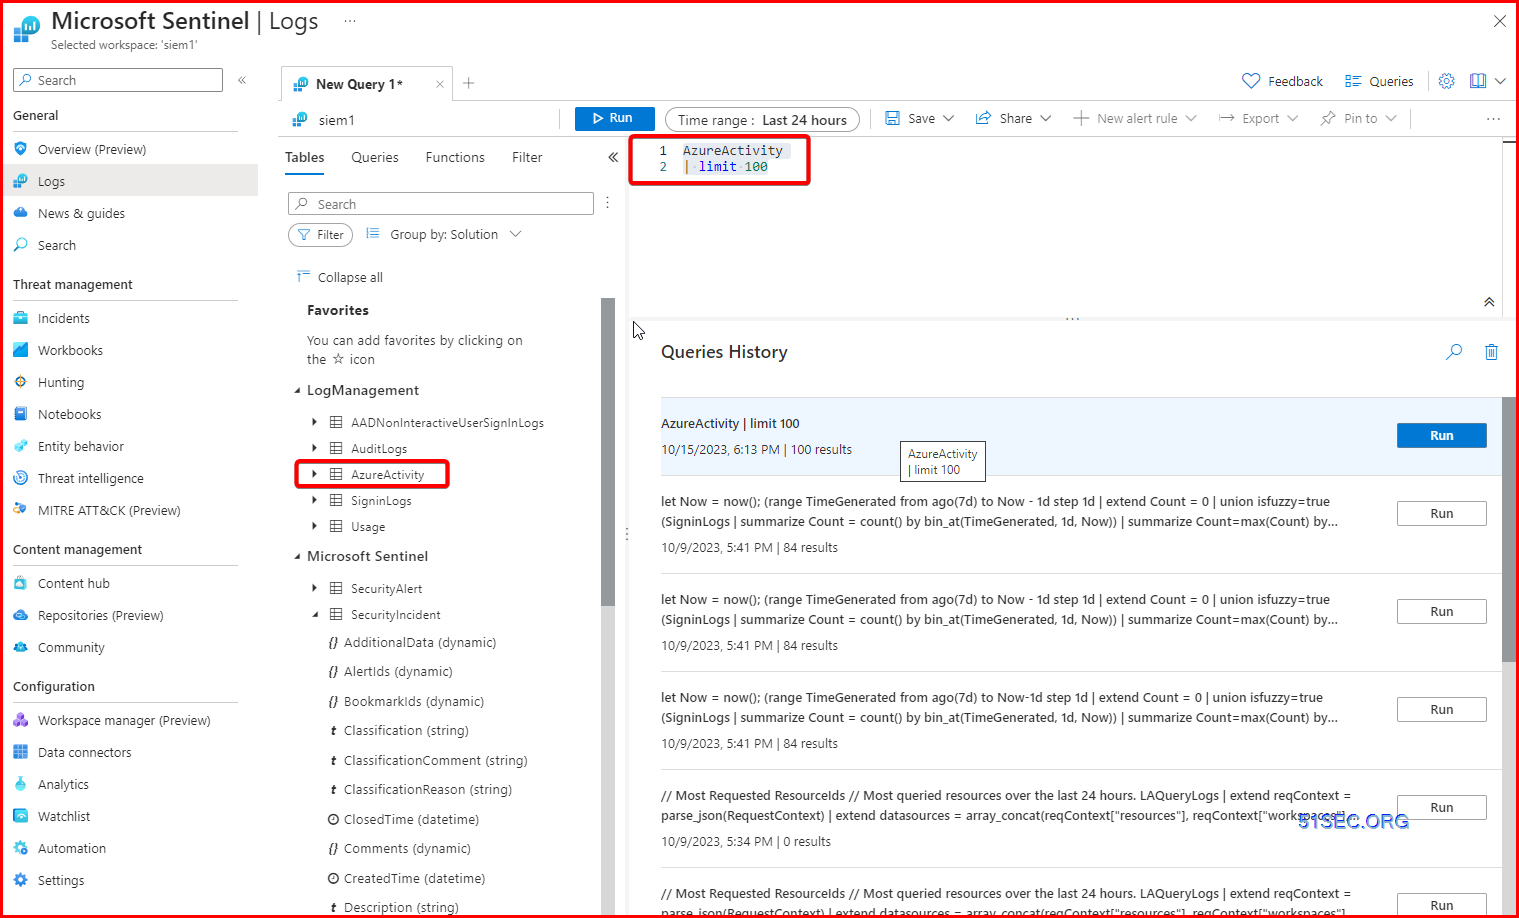
Kusto Query Language is the language you will use to work with and manipulate data in Microsoft Sentinel. The logs you feed into your workspace aren’t worth much if you can’t analyze them and get the important information hidden in all that data. Kusto Query Language has not only the power and flexibility to get that information, but the simplicity to help you get started quickly. If you have a background in scripting or working with databases, a lot of the content of this article will feel very familiar. If not, don’t worry, as the intuitive nature of the language quickly enables you to start writing your own queries and driving value for your organization.
Basic KQL
Kusto Query Language is the language used across Azure Monitor, Azure Data Explorer and Azure Log Analytics (what Microsoft Sentinel uses under the hood). I have always found this visualization regarding KQL useful –
We want to use KQL to create accurate and efficient queries to find threats, detections, patterns and anomalies from within our larger data set.
Take the below query as an example
SigninLogs
| where TimeGenerated > ago(14d)
| where UserPrincipalName == "[email protected]"
| where ResultType == "0"
| where AppDisplayName == "Microsoft Teams"
| project TimeGenerated, Location, IPAddress, UserAgent
When we run a query like this the first line tells Microsoft Sentinel which table to look for data in, so in this case we want to search the SigninLogs table, which is where Azure AD sign in data is sent to. You can see a list of tables here.
Microsoft Sentinel will then run through your query sequentially, so it will run each line one by one until it hits the end, or you have an error. So to breakdown our query line by line.
SigninLogs
So first we have chosen our SigninLogs table.
SigninLogs
| where TimeGenerated > ago(14d)
Next we tell Sentinel to look back at the last 14 days worth of data in this table.
SigninLogs
| where TimeGenerated > ago(14d)
| where UserPrincipalName == "[email protected]"
Next we ask Sentinel to only find logs where UserPrincipalName is equal to “[email protected]“
SigninLogs
| where TimeGenerated > ago(14d)
| where UserPrincipalName == "[email protected]"
| where ResultType == "0"
Then we look for only logs where the ResultType == 0, which is a successful logon to Azure AD.
SigninLogs
| where TimeGenerated > ago(14d)
| where UserPrincipalName == "[email protected]"
| where ResultType == "0"
| where AppDisplayName == "Microsoft Teams"
Next we look for only signins to Microsoft Teams.
SigninLogs
| where TimeGenerated > ago(14d)
| where UserPrincipalName == "[email protected]"
| where ResultType == "0"
| where AppDisplayName == "Microsoft Teams"
| project TimeGenerated, Location, IPAddress, UserAgent
Our last line uses the project operator, to return only 4 fields from our logs, so we will only see the TimeGenerated, Location, IPAddress and UserAgent returned from our SigninLogs data.
System Query
Print out time and timezone
- let Now = now(); print Now
Search Keywords in Tables
search in (Syslog) “172.17.20.10”
CommonSecurityLog
| where DeviceVendor contains “Palo Alto Networks”
| where DeviceCustomString6 contains “LogForward”
| where Computer !contains “10”
| summarize count() by Computer
| where DeviceVendor =~ ‘SonicWall’
| summarize count() by Activity
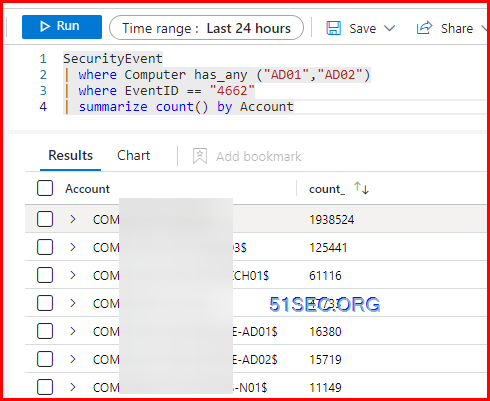
| where Computer has_any (“AD01″,”AD02”)
| where EventID == “4662”
| summarize count() by Account
Count Logs in a Table
Check Last 5 logs
Showing last 7 days log trending
Check certain table’s raw logs in last 1 hour:
Which Windows machine is sending logs through Azure Monitor Agemt?
Check Subscription ID
Rendor Operator to Draw a Diagram
Use the summarize operator to creat time series
Top 10 Pie Chart
Syslog
| where TimeGenerated > ago(7d)
| summarize Count=count() by Computer
| top 10 by Count
| render piechart
Bar Chart
Time series visualizations
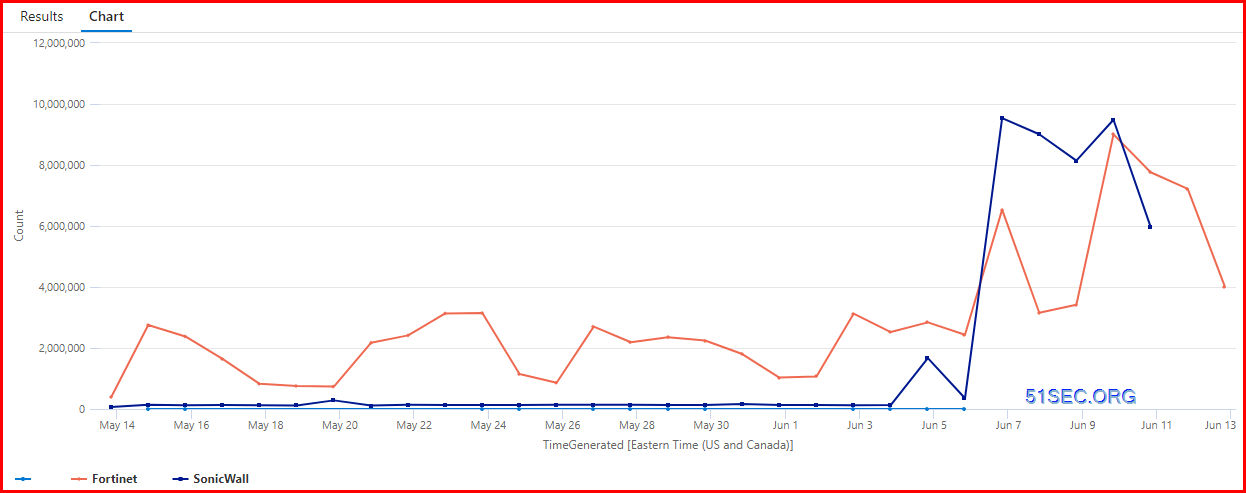
This will show the log counts based on DeviceVendor type for last 30 days in a timechart.
Extend , Order by, project, join Operator
Price Related
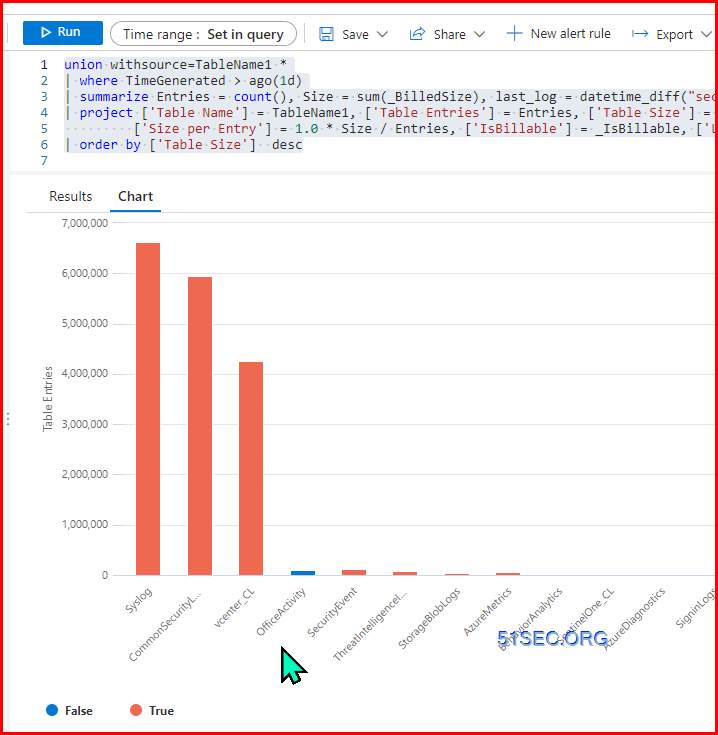
Check Table Sizes and if Billable
union withsource=TableName1 *
| where TimeGenerated > ago(1d)
| summarize Entries = count(), Size = sum(_BilledSize), last_log = datetime_diff("second",now(), max(TimeGenerated)), estimate  = sumif(_BilledSize, _IsBillable==true)  by TableName1, _IsBillable
| project ['Table Name'] = TableName1, ['Table Entries'] = Entries, ['Table Size'] = Size,
         ['Size per Entry'] = 1.0 * Size / Entries, ['IsBillable'] = _IsBillable, ['Last Record Received'] =  last_log , ['Estimated Table Price'] =  (estimate/(1024*1024*1024)) * 0.0
| order by ['Table Size']  desc
Calculate Cost Per Table
let rate = 4.30;                                 //<-- Effective per GB Price in EastUS (LAW & Sentinel per GB cost combined)
SecurityEvent                                     //<-- We're querying the SecurityEvent table in this one
| where TimeGenerated >ago(30d)                  //<-- Let's look at the past month, which makes sense considering we're billed monthly
| summarize GB=sum(_BilledSize)/1024/1024/1024    //<-- Summarize billable volume in GB using the _BilledSize table column
| extend cost = GB*rate                          //<-- Multiply total GBs for the month by the effective rate (defined in first line of query)
Check Specific Activities in the Log
‘1’,’event:system’,
‘1’,’event:user’,
‘1’,’event:user logon’,
‘1’,’event:vpn’,
‘1’,’utm:anomaly’,
‘1’,’utm:dlp’,
‘1’,’utm:dlp dlp-docsource’,
‘1’,’utm:dns’,
‘1’,’utm:dns dns-query’,
‘1’,’utm:dns dns-response’,
‘1’,’utm:emailfilter’,
‘1’,’utm:emailfilter bannedword’,
‘1’,’utm:emailfilter spam’,
‘1’,’utm:emailfilter webmail’,
‘1’,’utm:ips’,
‘1’,’utm:ips botnet’,
‘1’,’utm:ips malicious-url’,
‘1’,’utm:ips signature’,
‘1’,’utm:ssh ssh-channel’,
‘1’,’utm:ssh ssh-command’,
‘1’,’utm:ssh ssh-hostkey’,
‘1’,’utm:waf’,
‘1’,’utm:waf waf-address-list’,
‘1’,’utm:waf waf-custom-signature’,
‘1’,’utm:waf waf-http-constraint’,
‘1’,’utm:waf waf-http-method’,
‘1’,’utm:waf waf-signature’,
‘1’,’utm:waf waf-url-access’,
‘2’,’event:cifs-auth-fail’,
‘2’,’event:endpoint’,
‘2’,’event:rest-api’,
‘2’,’event:router’,
‘2’,’event:sdwan’,
‘2’,’event:sdwan down’,
‘2’,’event:sdwan up’,
‘2’,’event:webproxy’,
‘2’,’event:wireless’,
‘2’,’traffic:forward deny’,
‘2’,’traffic:ztna’,
‘2’,’utm:app-ctrl’ ,
‘2’,’utm:app-ctrl port-violation’,
‘2’,’utm:app-ctrl protocol-violation’,
‘2’,’utm:app-ctrl signature’,
‘2’,’utm:file-filter’,
‘2’,’utm:virus’,
‘2’,’utm:virus analytics’,
‘2’,’utm:virus command-blocked’,
‘2’,’utm:virus content-disarm’,
‘2’,’utm:virus ems-threat-feed’,
‘2’,’utm:virus exempt-hash’,
‘2’,’utm:virus infected’,
‘2’,’utm:virus inline-block’,
‘2’,’utm:virus malware-list’,
‘2’,’utm:virus outbreak-prevention’,
‘2’,’utm:virus oversize’,
‘2’,’utm:voip’,
‘2’,’utm:webfilter’,
‘2’,’utm:webfilter ftgd_blk’,
‘2’,’utm:webfilter ftgd_err’,
‘2’,’utm:webfilter urlfilter’,
‘2’,’utm:webfilter webfilter_command_block’,
‘3’,’event:connector’,
‘3’,’event:fortiextender’,
‘3’,’event:ha’,
‘3’,’event:switch-controller’,
‘3’,’event:wanopt’,
‘3’,’traffic:forward’,
‘3’,’traffic:forward accept’,
‘3’,’traffic:forward client-rst’,
‘3’,’traffic:forward close’,
‘3’,’traffic:forward dns’,
‘3’,’traffic:forward ip-conn’,
‘3’,’traffic:forward server-rst’,
‘3’,’traffic:forward timeout’,
‘3’,’traffic:local’,
‘3’,’traffic:local accept’,
‘3’,’traffic:local client-rst’,
‘3’,’traffic:local close’,
‘3’,’traffic:local deny’,
‘3’,’traffic:local server-rst’,
‘3’,’traffic:local timeout’,
‘3’,’traffic:multicast’,
‘3’,’traffic:sniffer’,
‘3’,’utm:casb’,
‘3’,’utm:emailfilter email’,
‘3’,’utm:emailfilter ftgd_err’,
‘3’,’utm:forti-switch’,
‘3’,’utm:forti-switch fsw-flow’,
‘3’,’utm:gtp’,
‘3’,’utm:gtp gtp-all’,
‘3’,’utm:gtp pfcp-all’,
‘3’,’utm:icap’,
‘3’,’utm:ssl ssl-anomaly’,
‘3’,’utm:ssl ssl-exempt’,
‘3’,’utm:ssl ssl-handshake’,
‘3’,’utm:ssl ssl-negotiation’,
‘3’,’utm:ssl ssl-server-cert-info’,
‘3’,’utm:virtual-patch’,
‘3’,’utm:virus filename’,
‘3’,’utm:virus filetype-executable’,
‘3’,’utm:virus mimefragmented’,
‘3’,’utm:virus scanerror’,
‘3’,’utm:virus switchproto’,
‘3’,’utm:webfilter activexfilter’,
‘3’,’utm:webfilter antiphishing’,
‘3’,’utm:webfilter appletfilter’,
‘3’,’utm:webfilter content’,
‘3’,’utm:webfilter cookiefilter’,
‘3’,’utm:webfilter ftgd_allow’,
‘3’,’utm:webfilter ftgd_quota’,
‘3’,’utm:webfilter ftgd_quota_counting’,
‘3’,’utm:webfilter ftgd_quota_expired’,
‘3’,’utm:webfilter http_header_change’,
‘3’,’utm:webfilter scriptfilter’,
‘3’,’utm:webfilter ssl-exempt’,
‘3’,’utm:webfilter unknown-ce’,
‘3’,’utm:webfilter urlmonitor’,
‘3’,’utm:webfilter videofilter-category’,
‘3’,’utm:webfilter videofilter-channel’,
‘3’,’event:security-rating’
];
CommonSecurityLog
| where DeviceVendor contains “Forti”
| summarize TotalActivity = count() by Activity
| lookup Watchlist on Activity
CommonSecurityLog
| where DeviceVendor contains “Forti”
| summarize TotalActivity = count() by Activity, bin(TimeGenerated,1d)
| lookup Watchlist on Activity
| render timechart
Resources
Create queries in Microsoft Sentinel using Kusto
-
LEARNING PATH
Configure your Microsoft Sentinel environment and Connect logs to Sentinel
-
ARTICLE
Create detections and perform investigations using Microsoft Sentinel
-
ARTICLE
-
ARTICLE
-
ARTICLE
Perform threat hunting with Microsoft Sentinel
-
ARTICLE
-
ARTICLE
-
ARTICLE
Additional Resources
-
CERTIFICATION
-
MICROSOFT TECH COMMUNITY
References
- https://learn.microsoft.com/en-us/azure/sentinel/kusto-overview


