This post is a summary for my experience with IBM Guardium product. Some of them are pretty simple. I am recording those for my own reference.
- Find Guardium STAP Installation Folder and Exec Stap Diag
- Shut Down System
- Inspection Engine Status is Fail
- Changing Report Parameters
- Add Reports into Dashboard to Check Logged Data
- Change GIM Client Configuration’s Guardium IP
- Remove inactive GIM client connection
- VA Report View Issue – Disable Data Level Security Filtering
- Unit Utilization Report Failed
- Central Manager shows all S-TAP offline (red)
Topology
Find Guardium STAP Installation Folder and Exec Diag
Sometimes, if stap already is having problem, run command from web gui wont work. You will have to go to your DB server’s command line to run it as show below:
[root@localhost tmp]# ps -ef | grep -i tap
root      1911   933  0 11:58 ?        00:00:00 /var/gim/modules/STAP/11.2.0.0_r108838_1-1598487907/guard_stap /var/gim/modules/STAP/11.2.0.0_r108838_1-1598487907/guard_tap.ini
root      5685  5104  0 13:07 pts/0    00:00:00 grep --color=auto -i tap
[root@localhost tmp]# cd /var/gim/modules/STAP/11.2.0.0_r108838_1-1598487907/
[root@localhost 11.2.0.0_r108838_1-1598487907]# ls
atap_must_gather.sh  config                        guard-config-update                guardium_evaluator.jar          guard-stap-setup            hooks                  libsasl2.so         platform_checks.sh
buffers              db2_exit_health_check.sh      guard_diag                         guardkerbplugin.conf            guard_tap.ini               libgssapiv2.so         libsasl2.so.3       ranger_dynpolicy_config.py
ca.cert.pem          depends                       guard_discovery                    guard_log4j_listener_config.py  guard_tap.ini.bak           libgssapiv2.so.3       libsasl2.so.3.0.0   rc
cit_config.xml       files                         guard_discovery.stderr.log         guard_sof                       guard_tap.ini.default_orig  libgssapiv2.so.3.0.0   LICENSE.TXT         STAP.log
common.sh            find_db2_shmem_parameters.sh  guard-gim-STAP-build.conf          guard_stap                      guard_tap.ini.prev          libguardkerbplugin.so  load_balance        trace_files
conf                 GIM.pm                        guardium_cassandra_audit-3.11.jar  guard_stap_analyze_tool.sh      guard_tap.ini.save_default  librdkafka.so          merge_ini_file.sh   uninstall
conf.bkp             guard-atap-ctl                guardium_cassandra_audit-3.4.jar   guard_stap.pid                  guard_validate_ip           librdkafka.so.1        monit-stap-control
[root@localhost 11.2.0.0_r108838_1-1598487907]# mkdir /tmp/guard_diag_out
[root@localhost 11.2.0.0_r108838_1-1598487907]# ./guard_diag /tmp/guard_diag_out/
Args /tmp/guard_diag_out/
LOG LEVEL 4
LOG TIME 60
This diagnostics script runs for approximately two minutes.  During the course
of its execution, it will gather data about various aspects of your system to
aid in analysing performance issues and other problems.  To do so, a couple of
processes will be started and terminated after a predetermined time-out.  On
some systems, this may cause some messages about processes being killed to be
printed below - this is normal and should not be cause for concern.

find: ‘/var/gim/modules/STAP/11.2.0.0_r108838_1-1598487907/./../../..//modules/CAS/current’: No such file or directory
./guard_diag: line 372:  6069 Killed                  tail -f /var/log/messages >> $KTAP_TEMP 2>&1
./guard_diag: line 372:  6071 Killed                  tail -f $tap_log_dir/guard_stap.stderr.txt >> $STAP_TEMP 2>&1
/dev/guard_ktap: No such file or directory
/var/gim/modules/STAP/11.2.0.0_r108838_1-1598487907/./../../..//modules/STAP/current/db2_exit_health_check.sh: line 145: /var/gim/modules/STAP/11.2.0.0_r108838_1-1598487907/./../../..//modules/STAP/current/guard-sign: No such file or directory
/var/gim/modules/STAP/11.2.0.0_r108838_1-1598487907/./../../..//modules/STAP/current/db2_exit_health_check.sh: line 146: /var/gim/modules/STAP/11.2.0.0_r108838_1-1598487907/./../../..//modules/STAP/current/guard-sign: No such file or directory
./guard_diag: line 1308: /var/gim/modules/STAP/11.2.0.0_r108838_1-1598487907/./../../..//modules/STAP/current/dump_shmem_stats: No such file or directory
cat: /tmp/guard_diag_out//diag.91vDi5/../stap_drop.log: No such file or directory
Diagnostics completed!  The results are in /tmp/guard_diag_out//diag.ustap.localhost.localdomain.20-08-31_130855.tar.gz
[root@localhost 11.2.0.0_r108838_1-1598487907]#
Find and Delete Large File in Guardium
guardium11.yourcompany.com> support show large_file 500 0

517     /var/IBM/Guardium/collector/bin/snif-debug
532     /var/IBM/Guardium/collector/bin/packet-run
722     /var/IBM/Guardium/collector/bin/snif
4097    /var/IBM/Guardium/data/mysql/ib_logfile0
4097    /var/IBM/Guardium/data/mysql/ib_logfile1
4097    /var/IBM/Guardium/data/mysql/ib_logfile2
4097    /var/IBM/Guardium/data/mysql/ib_logfile3
ok
guardium11.yourcompany.com>
To find files that are over a certain size and age, run the following CLI command:
support show large_files <size> <age>
support clean log_file <full path of file to delete>
Shut Down System

There are two methods to verify Inspection Engine:
- 1. “Standard Verification” – Sends a login request to the database defined in inspection engine with user “RESULTFD”. This login request should fail. If the inspection engine is configured and working correctly the S-TAP will send an exception to the collector with failed login. The verification process looks for this failed login, if it finds it then we know that the S-TAP can capture data from this inspection engine.
2. “Advanced Verification” – A user configured datasource is used to login to the database. The advanced verification runs a select on a table that does not exist. If the inspection engine is configured and working correctly the S-TAP will send an exception to the collector with database error.Verification process looks for this error, if it finds it then we know that the S-TAP can capture data from this inspection engine.
YouTube Video:
Reference: https://www.ibm.com/support/pages/what-do-if-guardium-inspection-engine-status-fail
Changing Report Parameters
- Run Time Parameters
- For these queries the QUERY_FROM_DATE and QUERY_TO_DATE can be changed to limit to show just the recent 3 minutes data for example
- click the pencil top right in v9 or wrench in v10.


Amend parameters

- Any of the Fields can be used to set a condition as normal and the report can the be re-saved and re-run – for example to restrict for a specific ServerIP …
- click the edit report icon at the top left in v10.

Add a condition – for example

Add Reports into Dashboard to Check Logged Data
Log in to your Collector WebUI, add following reports into your Dashboard:
1. Full SQL Count
2. Full SQL
3. Server Accessed
4. Open Sessions
5. Session count
Change GIM Client Configuration’s Guardium IP
Sometimes, you might want to point your GIM Client to different collector or aggregator. The following steps will show you how to change that.
1. Stop GIM service from GIM client server
2. Go to the path C:\Program Files (x86)\Guardium\Guardium Installation Manager\GIM\Current\
3. Edit the file “conf”
4. search GIM_URL and change ip from 172.23.1.29 (collector) to 172.23.1.28 (central manager)
5. Save the changes
6. Start GIM service
7. Verify from Guardium Central Manager
Based on How to move a GIM client to point to another appliance (GIM Server)?, there are two other ways to do it:
1. From Guardium Web GUI, Manage – module Installation – Set up Client
choose the GIM client and GIM bundle then change parameter GIM_URL to your new GIM appliance ip, install it now to get it updated.
2. From Guardium Client command line.
Remove inactive GIM client connection
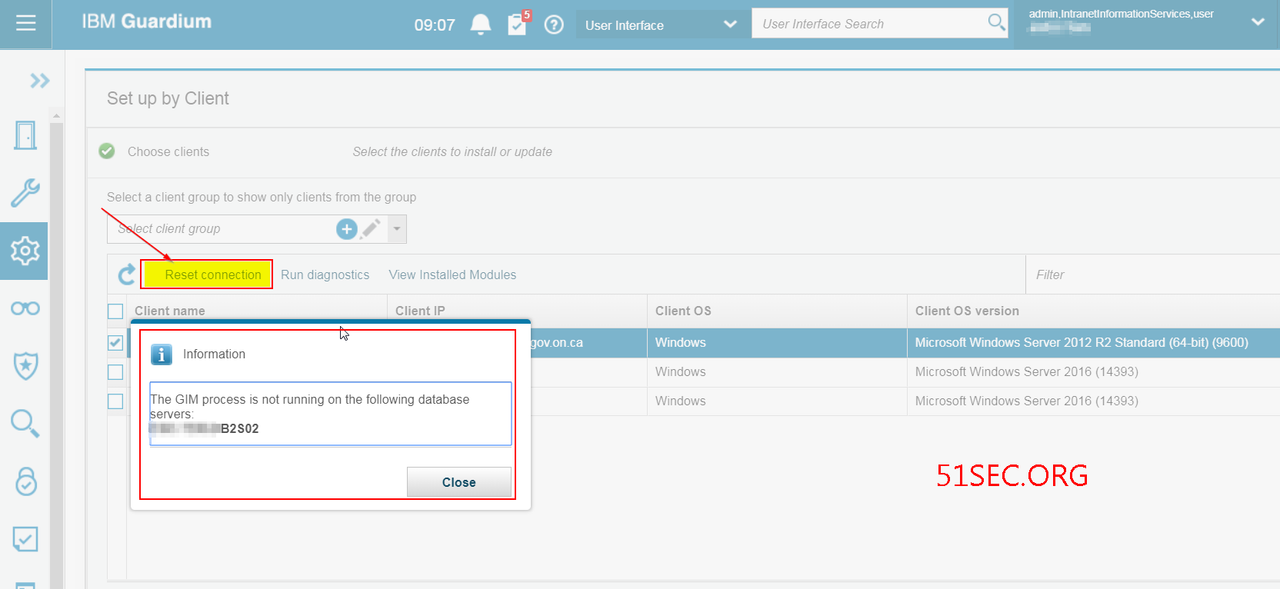
If your GIM client has pointed to different Guardium Aggregator / collector / central manager, you might received following notification about “The GIM process is not running on following database server”. In this case, you might want to delete this GIM connection by click “reset connection” in the Set up by Client page.
VA Report View Issue – Disable Data Level Security Filtering
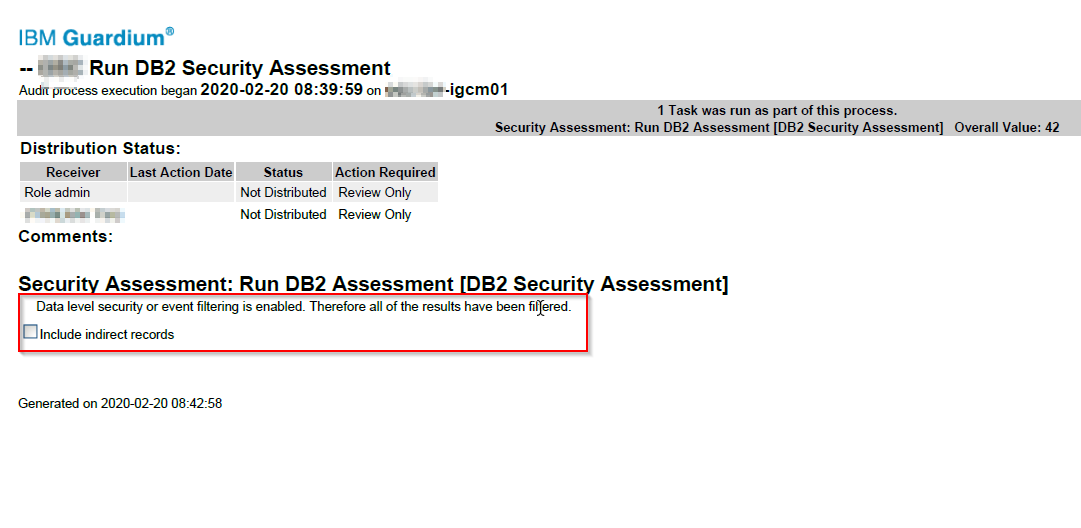
VA task has been scheduled to run and log shows it was completed successfully, but the report received shows empty with a information “Data level security or event filtering is enabled. Therefore all of the results have been filtered”
There is also a checkbox for “Include indirect records”.
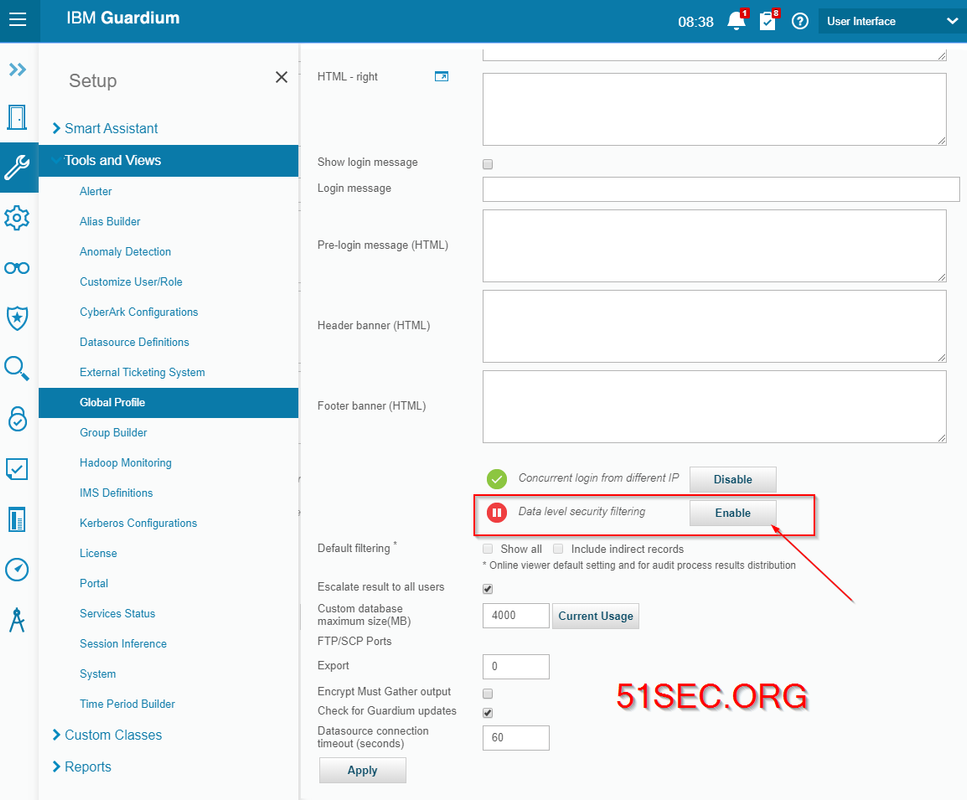
It is quite clear, Data level security was enabled for some reasons, such as segregate duties. It can be turned off at Setup > Tools and Views > Global Profile.
Unit Utilization Report Failed
Central Manager shows all S-TAP offline (red)
It might relate to inspection engine service if it is still offline after you verified the stap service on DB server and verified the firewall allowing port 9500 and 9501.
guardium-v11.yourcompany.com> restart inspection-core
Are you sure you want to restart inspection-core (y/n)?
Restarting inspection-core
ok
guardium-v11.yourcompany.com>
from Blogger http://blog.51sec.org/2020/01/ibm-guardium-troubleshooting-tips-and.html


