Sometimes, while browsing internet, there are some interesting docker images attracting my attention. I found it had better save them somewhere before I forgot them. Here comes this post. All those dockers have been tested @ Play with Docker .
- Install Docker/Docker Composer
- Matomo – Web analytics app
- Shiori – a Simple Bookmarks Manager
- A Simple PHP Web Proxy:miniProxy
- Instantbox-Create a Web temp linux
- Jellyfin – A Personal Media Server
- Deploy a CentOS Container
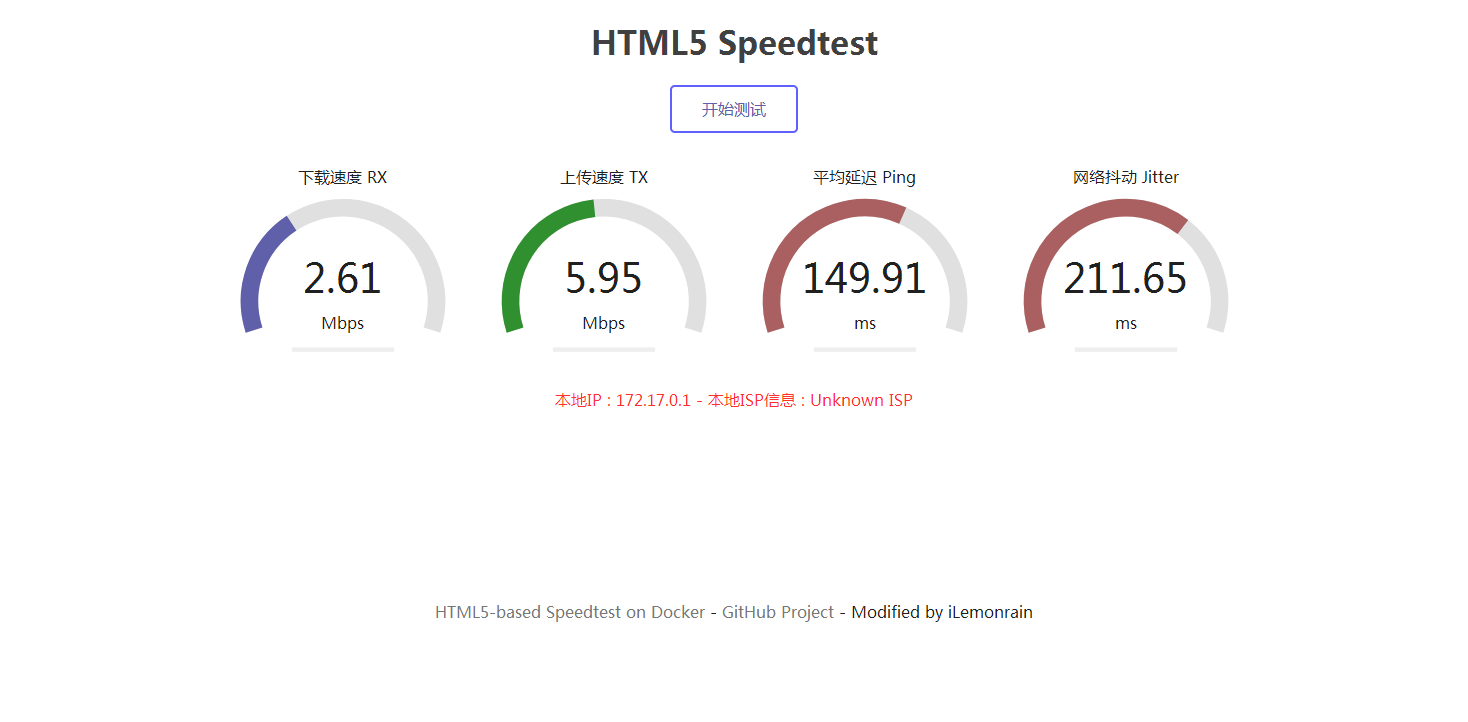
- HTML5-Based Speedtest to Your VPS
- ServerStatus
- NetData
- ttyd – Share your terminal over the web
- Yahei Php Probe
- Grafana+InfluxDB for Monitoring
Install Docker / Docker Composer
#CentOS 6
Or , references of my posts:
- Simplest Steps to Install Docker and Docker Compose into Ubuntu (16.04,18.04) and CentOS 7New
- Portainer and Docker UsageNew
chmod +x /usr/local/bin/docker-compose
Or Play with Docker online.
Matomo – Web analytics app
Matomo is a free and open source web analytics application runs on a PHP/MySQL web server. It tracks online visits to one or more websites and displays reports on these visits for analysis.
Docker URL:https://github.com/crazy-max/docker-matomo
#Pull Matomo image
docker run –restart=always -d –name matomo \
-p 8000:8000 \
-v ~/matomo/data:/data \
crazymax/matomo
#Pull MySQL image
docker run –restart=always –name mysqlmatomo -d \
-p 3306:3306 \
-e MYSQL_ROOT_PASSWORD=51sec123 \
-e MYSQL_DATABASE=matomo \
-e MYSQL_USER=matomo \
-e MYSQL_PASSWORD=51sec123 \
-v ~/matomo/mysql:/var/lib/mysql \
mysql:5.6
Shiori – a Simple Bookmarks Manager
Shiori is a simple bookmarks manager written in Go language. Intended as a simple clone of Pocket. You can use it as command line application or as web application. This application is distributed as a single binary, which means it can be installed and used easily.
Github URL:https://github.com/go-shiori/shiori
docker run -d –name shiori –restart=always -p 8080:8080 -v ~/shiori:/srv/shiori radhifadlillah/shiori
After installation, visit the address: http: // ip: 8080, the initial administrator username and password are shiori and gopher
A Simple PHP Web Proxy:miniProxy
use ip to visit
docker run –name miniproxy -d \
–restart=always \
-p 80:80 \
moerats/miniproxy
use domain name to visit
docker run –name miniproxy -d \
–restart=always \
-p 80:80 \
-p 443:443 \
-e domain=www.moerats.com \
moerats/miniproxy
Instantbox-Create a Web temp linux
Instantbox spins up temporary Linux systems with instant webshell access from any browser and currently supports various versions of Ubuntu, CentOS, Arch Linux, Debian, Fedora and Alpine.
https://github.com/instantbox/instantbox
Install Instantbox:
#期间会要你输入IP and 端口等信息
mkdir instantbox && cd $_
bash <(curl -sSL https://raw.githubusercontent.com/instantbox/instantbox/master/init.sh)
#启动容器
docker-compose up -d
By default it is ip:8888
Jellyfin – A Personal Media Server
Similar as Plex and Emby
Docker Installation:
docker run -d -p 8096:8096 -v /jellyfin/config:/config -v /jellyfin/media:/media jellyfin/jellyfin
Access ip:8096
You might need to fill in ffmpeg path ,which usually is at /usr/bin. You can check path by enter ‘which ffmpeg’
Deploy a CentOS Container
SSHlogin information:SSHchange your SSHpassword immediately after successful login to prevent malicious blasting.HTML5-Based Speedtest to Your VPS
http://ip:6688.ServerStatus
#Create folder
mkdir /home/ServerStatus
#get configuration file
cd /home/ServerStatus
wget --no-check-certificate https://raw.githubusercontent.com/91yun/ServerStatus/master/server/config.json
#create docker container sss
docker create --name=sss \
--restart=always \
-v /home/ServerStatus/config.json:/ServerStatus/server/config.json \
-p 3561:3561 \
-p 80:80 \
rongdede/serverstatus:server
docker start sss
http://<public ip>:80
More configuration details can be found from github site.
NetData
docker run -d --name=netdata \
  -p 19999:19999 \
  -v /proc:/host/proc:ro \
  -v /sys:/host/sys:ro \
  -v /var/run/docker.sock:/var/run/docker.sock:ro \
  --cap-add SYS_PTRACE \
  --security-opt apparmor=unconfined \
netdata/netdataversion: '3'
services:
netdata:
image: netdata/netdata
hostname: example.com # set to fqdn of host
ports:
- 19999:19999
cap_add:
- SYS_PTRACE
security_opt:
- apparmor:unconfined
volumes:
- /proc:/host/proc:ro
- /sys:/host/sys:ro
- /var/run/docker.sock:/var/run/docker.sock:rottyd – Share terminal over the web

https://hub.docker.com/r/tsl0922/ttyd/
$ docker run –restart=always –name ttyd -d -p 7681:7681 tsl0922/ttyd
1e156c668714c78a00755a3533b2031e0af03b3b555526a300909a52babe6c5d
[node1] (local) [email protected] ~/ttyd/build
Yahei PHP Probe
GitHub Repository: https://github.com/malaohu/php-yahei-tz
git clone https://github.com/malaohu/php-yahei-tz.git -b ibm_tz && mv php-yahei-tz/* ./
Run in docker:
Grafana+InfluxDB
mkdir -p /opt/pingmonitor && cd /opt/pingmonitor && nano docker-compose.yml
version: '3.5'

volumes:
    grafana-data:
    influxdb-data:

services:
    grafana:
        image: grafana/grafana
        container_name: grafana
        environment:
            - GF_AUTH_ANONYMOUS_ENABLED=true
        ports:
            - 3000:3000
        volumes:
            - grafana-data:/var/lib/grafana
        restart: unless-stopped

    influxdb:
        image: influxdb
        container_name: influxdb
        environment:
            - INFLUXDB_HTTP_AUTH_ENABLED=true
            - INFLUXDB_DB=telegraf
            - INFLUXDB_ADMIN_USER=admin
            - INFLUXDB_ADMIN_PASSWORD=password
            - INFLUXDB_USER=telegraf
            - INFLUXDB_USER_PASSWORD=password
        ports:
            - 8086:8086
        volumes:
            - influxdb-data:/var/lib/influxdb
        restart: unless-stopped
docker-compose up -d
